Pocatello, ID Cap Rate 2.16%
Pocatello is the second-largest metro in eastern Idaho — anchored by Idaho State University, the Union Pacific Railroad operations, and the broader Snake River Plain economy. The 2.16% cap rate at a $345,000 median price keeps the 0.31% rent-to-price ratio close to functional. Population growth at 2.6%/yr is steady.
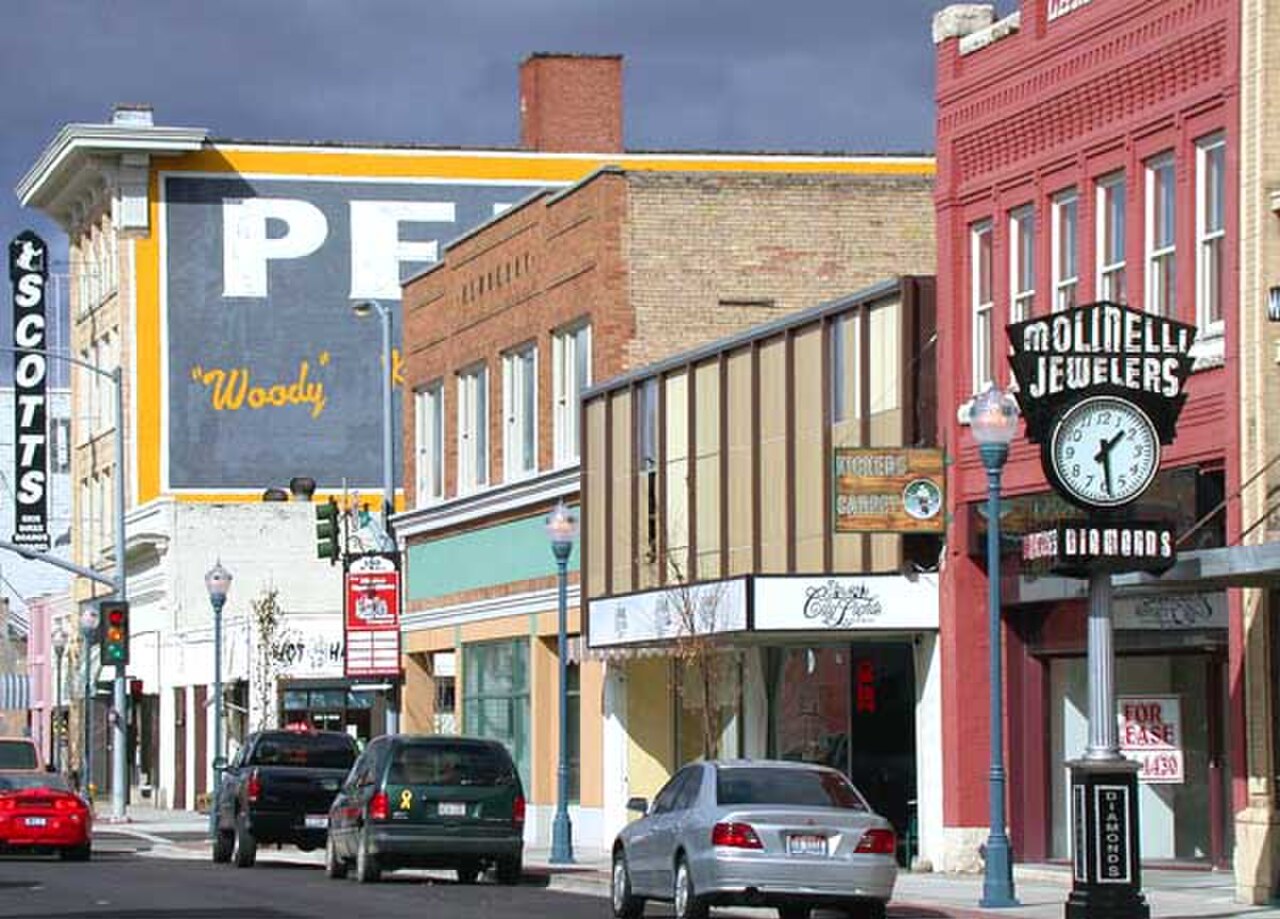
Employment is anchored by Idaho State University (the regional public university with ~12K students plus the broader research and athletic enterprise — ISU has historically-strong health-sciences programs), Portneuf Medical Center, the Union Pacific Railroad operations (Pocatello is a major UP rail hub with significant yards, mechanical, and crew-base operations), Idaho National Laboratory operations spillover (INL is headquartered in Idaho Falls 50 miles north — some commuter activity), the broader Bannock County government, Heinz / Idahoan Foods potato processing operations, and a meaningful agricultural-services base. Submarkets stratify cleanly: the historic Old Town Pocatello area is walkable urban-historic with strong appreciation; the broader Highland and Chubbuck north areas are family-school suburban; the ISU-adjacent zones are student-heavy with operational complexity tied to August-to-July leasing; the broader Bannock County extends with rural-edge construction; central Pocatello offers deeper-value workforce inventory.
Idaho property tax at 0.64% is moderate, with a homeowner's exemption that doesn't apply to non-occupant rentals (model the non-owner-occupied basis). Idaho state income tax is a flat ~5.8%. Insurance is reasonable. The structural advantages: ISU enrollment is durable; Union Pacific rail employment is structurally tied to broader US rail demand; INL spillover provides federal-research-employee tenant overflow; cost basis is materially below Boise or Coeur d'Alene. The structural risks: student-market concentration produces summer vacancy if leases aren't structured for August-to-July; cold-climate operational complexity; broader Eastern Idaho population trajectory has been mixed. For investors who want Idaho exposure outside the Boise/CDA pricing structure with a defensible university anchor, Pocatello is the most defensible Eastern Idaho option.
Market data powered by Zillow Home Value Index (ZHVI) and Zillow Observed Rent Index (ZORI) · Updated Feb 2026
Market Data
2026 Market Update: Pocatello
Pocatello's 0.3% rent-to-price ratio is well below the 1% rule. At median prices of $345,000, the $1,080/mo rent produces only $621/mo in NOI. Investors here need to target below-median properties or pursue value-add strategies to make the numbers work.
At current rates, a 20% down conventional loan ($69K at 7%) would result in approximately $-1,214/mo cash flow — negative at median prices. Larger down payments, seller financing, or buying 15–25% below median are strategies to turn the numbers positive.
The 26.6x gross rent multiplier and 4.2% vacancy rate position Pocatello as a growth-dependent market. With annual appreciation at 2.4%, total returns (cash flow + equity growth) run approximately 4.6% before financing leverage.
Deal Modeling & Scenarios for Pocatello
All figures below are computed from Pocatello's real market medians. Use them as a baseline; override with property-specific numbers in the calculators.
Property Tax Bill in Real Dollars
At 0.64% effective rate on the $345,000 median price, the annual tax bill is $2,208 — that's below national average (-40% vs the national average of ~1.06%). Verify the actual assessed value before purchase; sale-triggered reassessments can push the bill higher than the seller's current statement.
5-Year Cap Rate Trajectory
If Pocatello continues appreciating at 2.4%/yr while rents grow at a conservative 3%/yr, cap rate holds roughly steady as price growth outpaces rent. Year-by-year projection at the median:
| Year | Est. Price | Est. Rent/Mo | Cap Rate |
|---|---|---|---|
| Today | $345K | $1,080 | 2.2% |
| Year 1 | $353K | $1,112 | 2.2% |
| Year 2 | $362K | $1,146 | 2.2% |
| Year 3 | $370K | $1,180 | 2.2% |
| Year 4 | $379K | $1,216 | 2.2% |
| Year 5 | $388K | $1,252 | 2.2% |
Three Financing Scenarios
Same median-priced Pocatello property — different capital structures. All-cash maximizes cap rate. Leverage trades cash flow for higher cash-on-cash return when the spread between cap rate and borrowing cost is positive.
| Scenario | Cash Invested | Monthly Cash Flow | Annual CF | Cash-on-Cash |
|---|---|---|---|---|
| All cash | $345K | $621 | $7,448 | 2.2% |
| 20% down conventional @ 7% | $79K | $-1,215 | $-14,577 | -18.4% |
| 25% down DSCR @ 8.5% | $100K | $-1,369 | $-16,430 | -16.4% |
Three Price Tiers: Below, At, and Above the Median
Properties don't always trade at the median. Lower-priced units typically offer higher cap rates but harder operations; higher-priced properties tend to compress cap rates while attracting better tenants. All-cash assumptions below:
| Tier | Price | Rent/Mo | NOI/Yr | Cap Rate | Monthly CF |
|---|---|---|---|---|---|
| Below median (~75% price) | $259K | $918 | $6,100 | 2.4% | $508 |
| At median | $345K | $1,080 | $6,754 | 2.0% | $563 |
| Above median (~125% price) | $431K | $1,242 | $7,408 | 1.7% | $617 |
Total Return Over a 5-Year Hold
Cap rate is just one piece. Real estate returns come from four sources: cash flow, appreciation, principal paydown, and tax benefits. Assuming 20% down conventional financing at 7% and a 5-year hold at Pocatello's historical appreciation rate of 2.4%:
On a $69K down payment, that's a -12.7% total ROI over 5 years (not annualized). Tax benefits from depreciation are additional and depend on your personal tax bracket.
Risk Flags Specific to Pocatello
Automated checks against the underlying data — surface only the risks that actually apply to Pocatello, not generic boilerplate:
Cap Rate Calculator — Pocatello
Pre-filled with Pocatello medians. Adjust to match a specific property.
Cash-on-Cash Return — Pocatello
Factor in financing to see your actual return on invested capital in Pocatello.
Is Pocatello a Good Place to Invest in Rental Property?
Pocatello, ID has a population of 50,000 and has been growing at 2.6% annually — well above the national average, signaling strong housing demand from population inflows. The median home price of $345,000 paired with median rents of $1,080/mo produces an estimated cap rate of 2.16%.
Property taxes at 0.64% are well below the national average of ~1.1%, providing a meaningful cash flow advantage many investors overlook. The vacancy rate of 4.2% is impressively low, indicating tight rental supply and strong tenant demand — favorable for landlords.
At a price-to-income ratio of 5.9x, homes cost about 5.9 times the local median income of $58,040. This moderate ratio indicates a balanced rent-vs-buy market. Home values have appreciated at roughly 2.4% annually. Steady appreciation means total returns will be primarily cash flow-driven — the more sustainable model for long-term wealth building.
Bottom line: At current median prices, Pocatello is challenging for pure cash flow investing. Consider BRRRR strategies with below-market purchases, or look at neighboring metros with stronger price-to-rent ratios.