Chandler, AZ Cap Rate 3.01%
Chandler is the fourth-largest city in Arizona and the heart of the East Valley tech corridor — uniquely anchored by Intel's Ocotillo campus (one of Intel's largest US semiconductor manufacturing facilities), Microchip Technology's corporate headquarters, and the broader Phoenix metro tech-and-aerospace cluster. The 3.01% cap rate at a $445,000 median price keeps the 0.39% rent-to-price ratio close to functional than Phoenix proper. Population growth at 1.8%/yr is among the stronger Sun Belt numbers.
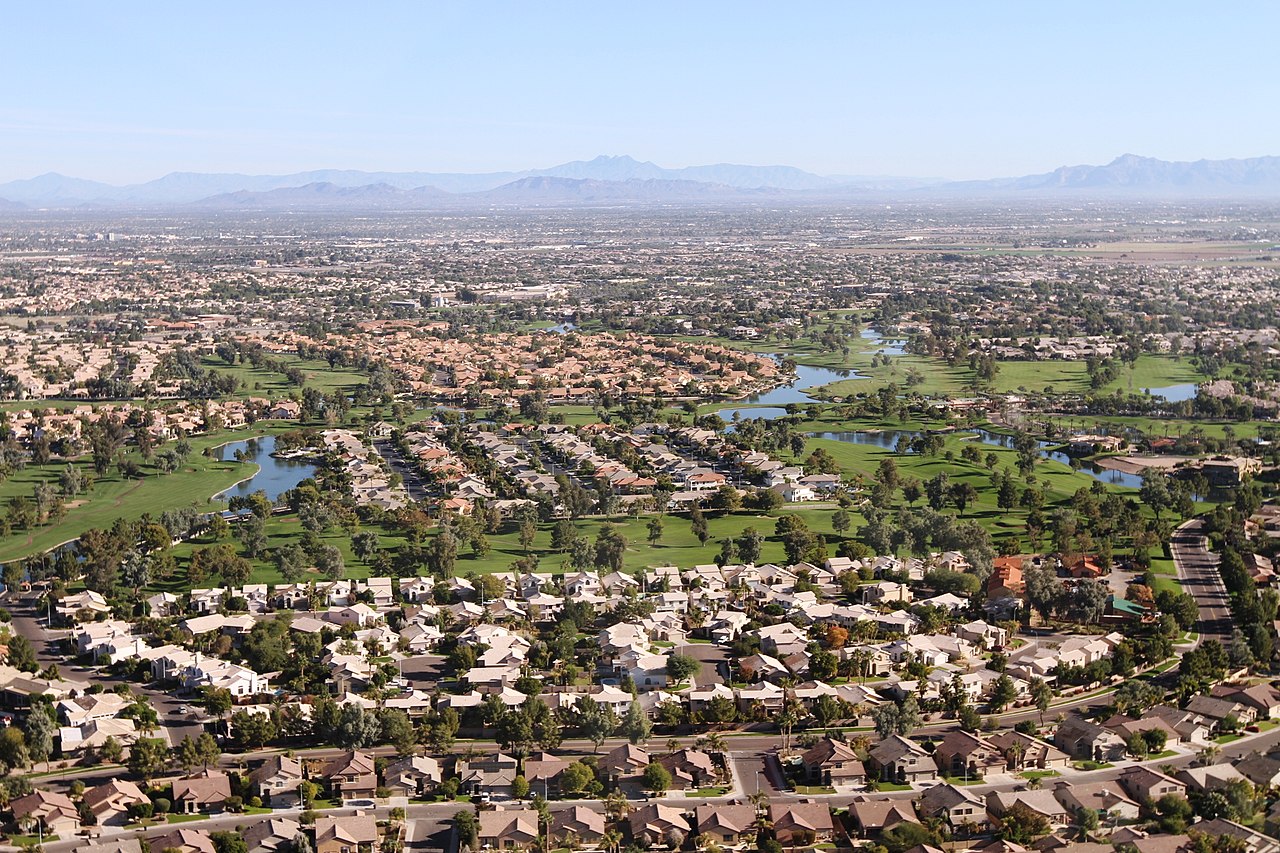
Employment is anchored by Intel's Ocotillo campus in Chandler (one of Intel's major US semiconductor manufacturing complexes, with ongoing multi-billion-dollar Fab 52 and Fab 62 expansion — Chandler is genuinely one of the more important US semiconductor manufacturing hubs, with the broader supplier ecosystem extending throughout the East Valley), Microchip Technology (HQ — the major Fortune 500 semiconductor company headquartered in Chandler), Northrop Grumman Mission Systems major Chandler operations, Avnet (electronics-components distributor — HQ in nearby Phoenix with major Chandler presence), Dignity Health Chandler Regional Medical Center, the broader Chandler-Gilbert Community College, the broader City of Chandler government, and Bashas' supermarket chain. Submarkets stratify cleanly: Ocotillo (the master-planned community near Intel) and Sun Lakes (retirement community) are premium suburban-school zones drawing tech-professional family rentals; the broader Chandler ISD zones are family-school suburban; the broader downtown Chandler is gentrifying with new mixed-use development; the broader Chandler extends with newer construction.
Arizona property tax at 0.61% is among the lower rates nationally. AZ state income tax is moving toward a flat ~2.5%. Insurance is reasonable but verify monsoon / hail deductible structure. The structural advantages: Intel's multi-billion-dollar Ocotillo expansion (under CHIPS Act funding plus Intel's own commitment) is structurally transformative — sustained high-wage engineering employment growth; Microchip + Northrop + Avnet provides corporate-HQ + Fortune 500 employer concentration unusual for an East Valley suburb; AZ tax structure is genuinely landlord-favorable; pricing has compressed but the tech-employment thesis is durable. The structural risks: heavy Intel concentration matters (Intel's broader corporate trajectory has been challenging through 2023-2025, though Ocotillo expansion appears committed); Phoenix metro water access is a long-term variable. For investors who want premium East Valley exposure with tech-employer durability, Chandler is the most defensible AZ tech-corridor option.
Market data powered by Zillow Home Value Index (ZHVI) and Zillow Observed Rent Index (ZORI) · Updated Feb 2026
Market Data
2026 Market Update: Chandler
Chandler's 0.4% rent-to-price ratio is well below the 1% rule. At median prices of $445,000, the $1,720/mo rent produces only $1,115/mo in NOI. Investors here need to target below-median properties or pursue value-add strategies to make the numbers work.
At current rates, a 20% down conventional loan ($89K at 7%) would result in approximately $-1,252/mo cash flow — negative at median prices. Larger down payments, seller financing, or buying 15–25% below median are strategies to turn the numbers positive.
The 21.6x gross rent multiplier and 4.8% vacancy rate position Chandler as a growth-dependent market. With annual appreciation at 3.1%, total returns (cash flow + equity growth) run approximately 6.1% before financing leverage.
Deal Modeling & Scenarios for Chandler
All figures below are computed from Chandler's real market medians. Use them as a baseline; override with property-specific numbers in the calculators.
Property Tax Bill in Real Dollars
At 0.61% effective rate on the $445,000 median price, the annual tax bill is $2,715 — that's below national average (-42% vs the national average of ~1.06%). Verify the actual assessed value before purchase; sale-triggered reassessments can push the bill higher than the seller's current statement.
5-Year Cap Rate Trajectory
If Chandler continues appreciating at 3.1%/yr while rents grow at a conservative 3%/yr, cap rate compresses as price growth outpaces rent. Year-by-year projection at the median:
| Year | Est. Price | Est. Rent/Mo | Cap Rate |
|---|---|---|---|
| Today | $445K | $1,720 | 3.0% |
| Year 1 | $459K | $1,772 | 3.0% |
| Year 2 | $473K | $1,825 | 3.0% |
| Year 3 | $488K | $1,879 | 3.0% |
| Year 4 | $503K | $1,936 | 3.0% |
| Year 5 | $518K | $1,994 | 3.0% |
Three Financing Scenarios
Same median-priced Chandler property — different capital structures. All-cash maximizes cap rate. Leverage trades cash flow for higher cash-on-cash return when the spread between cap rate and borrowing cost is positive.
| Scenario | Cash Invested | Monthly Cash Flow | Annual CF | Cash-on-Cash |
|---|---|---|---|---|
| All cash | $445K | $1,115 | $13,375 | 3.0% |
| 20% down conventional @ 7% | $102K | $-1,253 | $-15,034 | -14.7% |
| 25% down DSCR @ 8.5% | $129K | $-1,452 | $-17,424 | -13.5% |
Three Price Tiers: Below, At, and Above the Median
Properties don't always trade at the median. Lower-priced units typically offer higher cap rates but harder operations; higher-priced properties tend to compress cap rates while attracting better tenants. All-cash assumptions below:
| Tier | Price | Rent/Mo | NOI/Yr | Cap Rate | Monthly CF |
|---|---|---|---|---|---|
| Below median (~75% price) | $334K | $1,462 | $10,524 | 3.2% | $877 |
| At median | $445K | $1,720 | $11,852 | 2.7% | $988 |
| Above median (~125% price) | $556K | $1,978 | $13,181 | 2.4% | $1,098 |
Total Return Over a 5-Year Hold
Cap rate is just one piece. Real estate returns come from four sources: cash flow, appreciation, principal paydown, and tax benefits. Assuming 20% down conventional financing at 7% and a 5-year hold at Chandler's historical appreciation rate of 3.1%:
On a $89K down payment, that's a 28.0% total ROI over 5 years (not annualized). Tax benefits from depreciation are additional and depend on your personal tax bracket.
Risk Flags Specific to Chandler
Automated checks against the underlying data — surface only the risks that actually apply to Chandler, not generic boilerplate:
Cap Rate Calculator — Chandler
Pre-filled with Chandler medians. Adjust to match a specific property.
Cash-on-Cash Return — Chandler
Factor in financing to see your actual return on invested capital in Chandler.
Is Chandler a Good Place to Invest in Rental Property?
Chandler, AZ has a population of 283,368 and has been growing at 1.8% annually — above the national average, suggesting steady demand pressure on housing. The median home price of $445,000 paired with median rents of $1,720/mo produces an estimated cap rate of 3.01%.
Property taxes at 0.61% are well below the national average of ~1.1%, providing a meaningful cash flow advantage many investors overlook. The vacancy rate of 4.8% is impressively low, indicating tight rental supply and strong tenant demand — favorable for landlords.
At a price-to-income ratio of 5.4x, homes cost about 5.4 times the local median income of $82,400. This moderate ratio indicates a balanced rent-vs-buy market. Home values have appreciated at roughly 3.1% annually. Steady appreciation means total returns will be primarily cash flow-driven — the more sustainable model for long-term wealth building.
Bottom line: At current median prices, Chandler is challenging for pure cash flow investing. Consider BRRRR strategies with below-market purchases, or look at neighboring metros with stronger price-to-rent ratios.